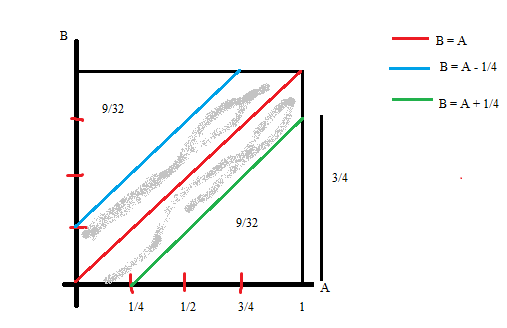
For the first question, it would be easy if you visualize it as a graph.

I'm taking the X axis to represent A's time of arrival and Y to represent B's time of arrival.
Since we're only dealing with a 1 hour time frame, and they also make decisions on a block of 15 minutes, I'm dividing the time space into 4 chunks of 15 minutes each. Now the probability that a person may arrive at any instant in time is going to be 1/60 (in 1 hour=60 minutes, probability of arrival at any minute is the same and equal to 1/60 iid). So P(arriving in the 1st 15 minutes) = 1/4 and so on.
Now the red line running diagonally B = A, represents the cases where they both arrive at the same instant in time. The green line gives the bound for how late B can come and still catch A (B = A + 1/4) and the blue line gives how early B can come and still catch A before it's time for him to leave.
The area shaded in gray is what is being asked (ie, this is the probability region which represents them meeting). So find the area of the lower green triangle. This will be 9/32. Symmetrically, the upper blue triangle also has the same area. Subtract this from the area of the square and you have the required probability.
I think you may find solutions online which use probability distributions to solve this, but I think this graphical approach gives a more intuitive understanding of the problem. Hope this helps.
Cheers